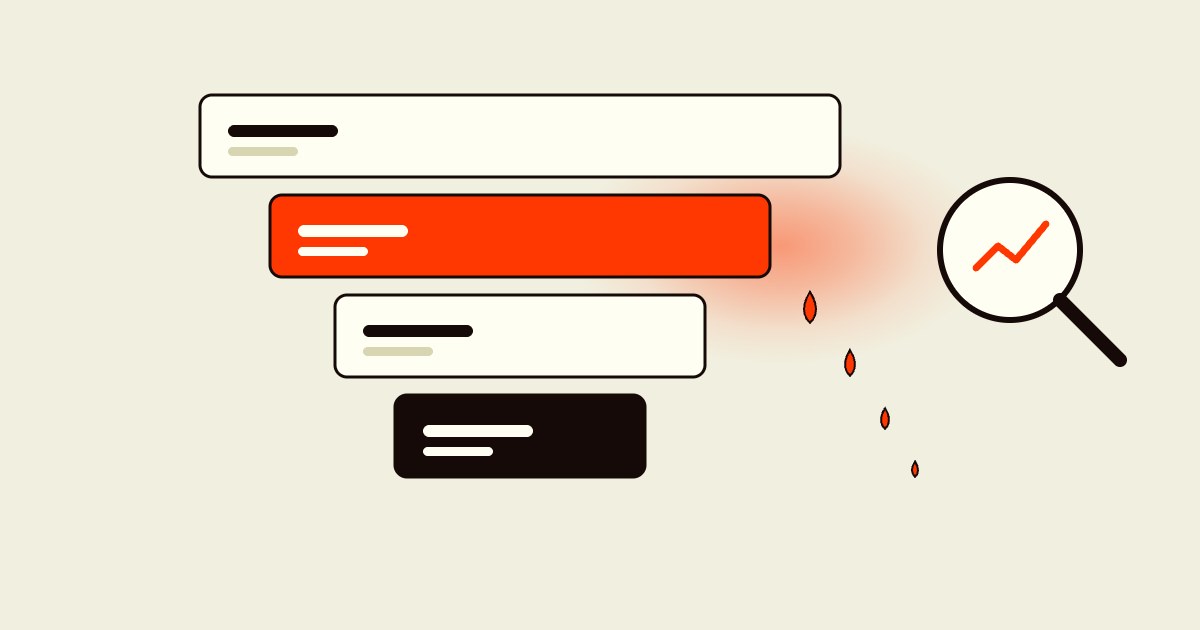
A website conversion funnel is the path from a visitor's first page view to a completed order, measured step by step. The average ecommerce store converts about 2.66% of sessions (Dynamic Yield), and the gap between that and a strong store is rarely one big problem. It is a set of leaks at specific stages. The fastest way to grow conversion is to find the stage that loses the most orders and fix that one first.
- Four stages: landing, product page, cart, checkout. Each one loses shoppers for different reasons.
- Current benchmarks: 2.66% average conversion rate and 5.96% average add-to-cart rate (Dynamic Yield); 70.22% average cart abandonment (Baymard Institute).
- Measure the step-to-step rates in Shopify or GA4, split by device and traffic source, before changing anything.
- Fix the stage that costs the most orders, not the one with the scariest percentage.
What are the stages of an ecommerce conversion funnel?
Marketing funnels often start with awareness and end with loyalty. On the website itself, four stages decide whether a visit becomes an order. Each has one job, and each fails in its own way.
| Stage | The visitor's question | How it usually fails |
|---|---|---|
| 1. Landing | Is this for me? | The page describes the brand instead of answering why this product, for this visitor, now. The message doesn't match the ad or link that brought them. |
| 2. Product page | Is this the right one, and is it worth the price? | Features and ingredients without the benefit, the proof or the answer to the main objection. |
| 3. Cart | What will it really cost, and what if I change my mind? | Shipping or fees appear late, returns are unclear, or a login prompt interrupts. |
| 4. Checkout | Is this quick and safe? | Too many fields, forced accounts, a card form that doesn't look secure, missing wallets on mobile. |
The cart and checkout are the best-researched stages. Baymard Institute's survey of US shoppers finds the top reasons for abandoning a checkout are extra costs such as shipping, tax and fees (40%), slow delivery (20%), not trusting the site with card details (19%) and being asked to create an account (18%). Cart abandonment statistics has the full list.
What are good conversion funnel benchmarks?
Benchmarks give you a rough baseline, not a target. They come from different datasets and definitions, so use each one for the stage it measures and compare your store mostly with its own trend.
| Metric | Benchmark | Source |
|---|---|---|
| Ecommerce conversion rate (sessions to orders) | 2.66% global average | Dynamic Yield, 400+ brands |
| Conversion rate, paid traffic | 1.69% median | Triple Whale, 53,000+ brands, Aug 2025 to Jul 2026 |
| Add-to-cart rate | 5.96% (mobile 6.19%, desktop 5.22%) | Dynamic Yield, past 12 months |
| Cart abandonment rate | 70.22% | Baymard Institute, average of 50 studies |
| Cart abandonment by device | Mobile 79.92%, desktop 69.19% | Dynamic Yield, past 12 months |
| Conversion rate by device (retail) | Desktop 3.7%, mobile 2% | Contentsquare, via Shopify |
Category matters more than any average. In Triple Whale's paid-traffic data, Food & Beverage converts at 2.60%, Beauty at 2.38% and Apparel & Accessories at 1.80%, while Electronics converts at 1.49%. Considered purchases convert less often but with larger orders.

How do you measure your own funnel?
You need four counts for the same period: sessions, sessions with an add to cart, sessions that reached checkout, and orders. Shopify's conversion rate report shows these directly as added to cart, reached checkout and completed checkout. In GA4, the purchase journey report covers the same steps from session start to purchase, as long as the ecommerce events are set up.
Then calculate the rate between each pair of steps, not only the overall conversion rate. Here is an illustrative store with 100,000 monthly sessions:
| Step | Sessions | Step rate | What it tells you |
|---|---|---|---|
| Sessions | 100,000 | Your traffic | |
| Added to cart | 7,000 | 7.0% of sessions | How well landing and product pages sell |
| Reached checkout | 3,500 | 50% of carts | Whether the cart builds or breaks confidence |
| Completed order | 2,100 | 60% of checkouts | Whether checkout gets out of the way |
| Overall conversion rate | 2.1% | The headline number |
Now estimate what a realistic improvement at each stage is worth. Lifting add-to-cart from 7.0% to 8.0% brings 1,000 more carts; at the same downstream rates that is 300 more orders. Lifting checkout completion from 60% to 65% brings 175 more orders. In this example the product page fix is worth about 70% more than the checkout fix, even though the checkout rate looks worse. That calculation, not the scariest percentage, decides where to start.
Glued's ROI calculator turns a change in conversion rate into revenue for your own traffic and order value.
How Glued finds the biggest leak
- Segment first. A blended 2.1% might be 3.5% on desktop and 1.4% on mobile, or strong from email and weak from paid social. Split every step by device, traffic source and new versus returning visitors before forming a hypothesis. If the leak is between checkout and purchase, our reached checkout but no sales guide walks through the four cuts.
- Size each leak. Use the calculation above to find the stage where a realistic improvement adds the most orders.
- Find out why. Analytics shows where shoppers stop; it doesn't show why. Session recordings, heatmaps, short surveys and a handful of moderated usability sessions on the problem stage usually reveal the cause.
- Change one thing and measure it. Test a single hypothesis at the problem stage, or ship it and compare against the baseline when traffic is too low to test. A/B testing for eCommerce covers when to test and when to ship.
- Re-run the funnel. Fixing a big leak often exposes the next one downstream. Repeat the analysis after each major change.
Real funnel fixes from Glued's client work
The four cases below each fixed a different stage. The figures are as published in each brand's case study.
Landing stage: Lull's story didn't stand out
Lull sells mattresses in a category where every brand promises better sleep. Its landing page worked, but nothing on it made Lull the obvious choice. Glued tested three completely different stories against each other: "Sleep Experts", "Dream Environments" and "Effortless Sleep". The winner lifted the begin-checkout rate 12.5%, doubled completed transactions and raised average revenue per user 61%. The funnel lesson: when the first stage lands, more shoppers move through every later stage too. Read the Lull case study.
Landing stage: Skin At Work was buying traffic for a leaking page
Skin At Work's ROAS had fallen to between 0.6 and 0.75, and the response had been more ad spend. The audit found the traffic was fine; the pages it landed on didn't build the trust skincare buyers need. Glued tested the offer framing, made educational content easy to reach and built a dedicated BFCM bundles page. Conversion rate rose 407%, ROAS rose to 1.35 and advertising costs fell 87%. Read the Skin At Work case study.
Product stage: Love Sweat Fitness couldn't change its own pages
Every update to Love Sweat Fitness's store needed a developer, so product pages fell behind the brand's offers. Glued rebuilt the store around modular sections and metafields the team could edit in Shopify. Within two weeks of launch, the add-to-cart rate rose 52% and conversion rate 33%: a product-stage fix that also made the next round of improvements faster. Read the Love Sweat Fitness case study.
Every stage: Yareli's site still showed the old brand
Yareli was moving from bath and beauty into wellness, but its store still told the old story, so wellness shoppers didn't see themselves in it. New imagery, UGC and rewritten key sections aligned the site with the products. Orders rose 283% and net sales 185%. Positioning problems leak at every stage, which is why fixing them moves the whole funnel. Read the Yareli case study.
Common fixes by funnel stage
| Stage | Fixes that usually pay off | Go deeper |
|---|---|---|
| Landing | Match the page to the ad or link; state who it's for and why above the fold; fast mobile load | CRO case studies |
| Product page | Benefit-led copy, proof next to Add to Cart, answers to the main objection, clear delivery and returns | Conversion psychology |
| Cart | Show shipping or the free-shipping threshold, guest checkout by default, trust signals below the button | Guest checkout vs account creation |
| Checkout | Fewer fields, express wallets first, a card section that looks secure, clear error recovery | Checkout flow optimization |
Navigation and search sit between landing and product pages on larger catalogs: if shoppers can't find the right product, the product page never gets a chance. Ecommerce filter design covers that part. For trust at the payment step, see checkout trust optimization.
The bottom line
A conversion funnel is only useful if it tells you where to act. Measure the rate between each step, split it by device and source, size each leak in orders, and fix the most expensive one first. Then measure again. The conversion rate optimization guide covers the full process. To find your store's biggest leak, start with a free audit, or see how Glued keeps improving the funnel month after month in Ongoing Optimizations.
FAQ
What is a website conversion funnel?
It is the path a visitor takes from landing on your store to completing an order, measured step by step: session, product view, add to cart, checkout started, order. Funnel analysis looks at the share of visitors who move from each step to the next, so you can see where most of them stop.
What are the stages of an ecommerce conversion funnel?
Four stages cover most stores: landing (does the visitor understand what you sell and stay?), product (does the product page earn the add to cart?), cart (does the shopper start checkout?) and checkout (does the order go through?). Each stage fails for different reasons and needs different fixes.
What is a good ecommerce conversion rate?
It depends on the category. Dynamic Yield's benchmark across more than 400 brands puts the global average at 2.66%, and Triple Whale's median for paid traffic across more than 53,000 brands was 1.69% (August 2025 to July 2026). Food and beauty convert higher; electronics and luxury convert lower. Compare yourself with your own category and your own trend.
Which funnel stage should I fix first?
The one that loses the most orders, not the one with the worst-looking rate. Multiply the visitors reaching each stage by the improvement you could realistically make there, and compare the extra orders. On most stores this points to the product page or the cart before the checkout form.
How do I measure my funnel in Shopify?
Shopify's conversion rate report breaks sessions into those that added to cart, reached checkout and completed checkout. In GA4, the purchase journey report shows the same steps from session start to purchase. Segment both by device and traffic source before you draw conclusions.
How long does funnel optimization take to show results?
Fixes at the cart and checkout can show up within weeks once enough orders come through. Love Sweat Fitness saw a 33% higher conversion rate and a 52% higher add-to-cart rate within two weeks of launching its rebuilt store. Positioning changes take longer to measure because they affect every stage at once.
Get A Free Website Audit.
We’ll identify what’s leaking revenue on your site and show you how to fix it. The free audit includes: