A full checkout and an empty order list is the ecommerce version of a restaurant where everyone reads the menu, sits down and walks out before ordering. The interest was there. Something at the table went wrong.
If your Shopify reports show plenty of sessions that reached checkout but no sales to match, you're in good company. It usually looks like this: strong add to cart, strong checkout started, a big drop to purchase, and a list of everything that looks fine. Shopify Payments on, PayPal on, Apple Pay and Google Pay on, free shipping, no surprise fees, no errors.
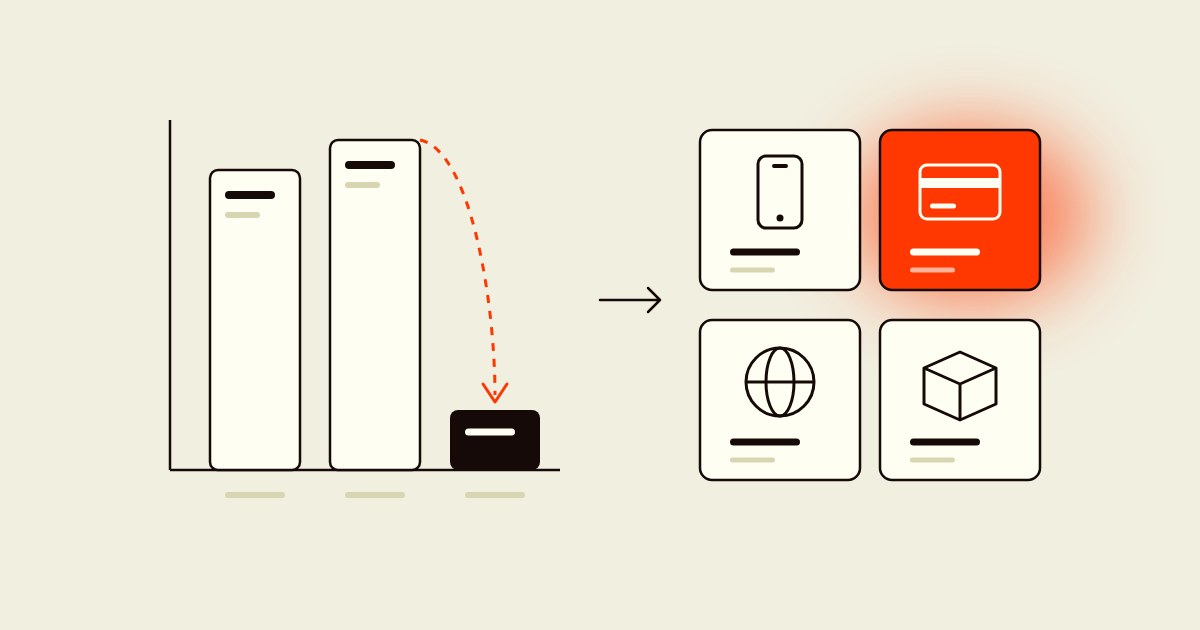
Here's the catch with "everything looks fine": it's an average. A checkout rarely breaks for everyone. It breaks for one phone, one payment method, one country or one cart size, and the blended number hides it. So before anyone redesigns anything, check that the drop is real, then cut it four ways.
- A checkout rarely breaks for everyone. It breaks for one phone, one payment method, one country or one cart size, and the average hides it.
- First check the drop is real: Shopify changed how it counts sessions between September 21 and 23, 2026, and its funnel divides every step by total sessions.
- Then cut the drop four ways: device, payment method, market and currency, and shipping cost.
- Extra costs like shipping, tax and fees are still the top fixable reason U.S. shoppers abandon, at 40% (Baymard Institute, 2026).
First, make sure the drop is real
Shopify counts a session as having reached checkout when there was "user input (for example, a key press or mouse click) during checkout," according to its Behavior reports documentation. In the open version of the Conversion rate breakdown funnel, Shopify says a visitor "might directly reach the checkout page without having added items to the cart," and that session still counts. So a checkout started is a shopper who clicked or typed something in checkout. It isn't a promise to buy.
The way Shopify counts sessions also changed this fall. Between September 21 and 23, 2026, Shopify rolled out a session measurement update: sessions no longer end at midnight UTC, some sessions without a pageview now count (Shopify's example is "a customer going directly to checkout from a cart link"), and identified bot sessions are filtered out by default. Shopify's advice is to treat the update as a new baseline and not to compare across it as if nothing happened.
Two quick checks before you go further:
- Compare periods that both fall after the update, with the same Human or bot filter setting on both.
- Calculate checkout completion yourself: sessions that completed checkout divided by sessions that reached checkout. Shopify's funnel percentages divide every step by total sessions, which makes the last step look smaller than it is. Then check the number against your actual orders for the same dates.
If the drop survives that, it's real. Time to cut.

Cut 1: Device
Start here because it's the fastest. Shopify has a Sessions by device report, and the same Behavior reports page says you can ask Sidekick something as plain as "Show my conversion rate by device type for the last 30 days."
Some gap between mobile and desktop is normal, and we cover the benchmark in our checkout optimization guide. What you're looking for is a gap that's much wider than your own history, or one device type that fell off a cliff on a specific date. A date usually means a release: a theme update, a new checkout app, a pop-up that now covers the pay button on small screens.
If mobile is the problem, test the checkout on a real phone, on cellular data, with autofill off. That's how a stranger shops.
Cut 2: Payment method
Payment is where intent turns into a card number, and where trust gets tested. In Baymard Institute's survey of U.S. shoppers, updated October 28, 2026, 19% of those who abandoned (leaving out the "just browsing" crowd) said they didn't trust the site with their card details, 10% said the card was declined and 9% said there weren't enough payment methods.
Shopify's funnel stops at "reached checkout," so you need one more layer to see which method shoppers chose before they left. If you send GA4 ecommerce events, Google's add_payment_info event has a payment_type parameter for "the chosen method of payment." Compare add_payment_info to purchase by payment_type. A method with plenty of starts and few finishes is your suspect, even if your provider shows no errors.
Also check the other direction: which methods are missing for the shoppers you actually get. Our guide to payment method optimization covers presence versus prominence, and Shopify's newer payment method tiles change how the options look when you offer four or fewer.
Cut 3: Market and currency
International traffic can look healthy right up to the payment button. Shopify's Sessions by location report, listed in its Acquisition reports, shows where visitors come from. Put it next to orders by country for the same dates and look for a country with sessions and almost no orders.
Then look at what that shopper sees. If you collect duties at checkout, Shopify's duties documentation says the default is to "Show as line item," so the duty shows up as a new line on the total. The other option, "Duties included in price," means you pay the duties yourself instead of adding them to the customer's total. Shopify also warns that duties at checkout are estimates, and a missing country of origin or a wrong HS code "might result in additional duties being charged to the customer upon delivery."
A shopper who sees a price in their currency on the product page and a new charge at the last step behaves a lot like a shopper who got hit with surprise shipping. Which brings us to the last cut.
Cut 4: Shipping cost
Extra costs are still the top fixable reason people abandon. In the same Baymard survey, 40% blamed extra costs like shipping, tax and fees, 20% said delivery was too slow and 12% said they couldn't see or calculate the total cost up front.
Free shipping doesn't take you out of this cut. Plenty of stores with free shipping still lose orders here, because delivery speed sits at 20% on Baymard's list. In GA4, Google's add_shipping_info event carries a shipping_tier parameter (Google's examples are "Ground," "Air" and "Next-day"), so you can see which option shoppers picked before they left.
Our suggestion for the cut: compare carts just below your free shipping threshold with carts above it, and orders by shipping option. If the drop sits under the threshold or on the cheapest, slowest option, the shipping step is where shoppers are doing math and losing.
The four cuts on one page
| Cut | Where to look | What a problem looks like |
|---|---|---|
| Device | Shopify Sessions by device, or Sidekick | One device converts far below its own history |
| Payment method | GA4 add_payment_info by payment_type vs purchase | Many payment starts, few purchases for one method |
| Market and currency | Shopify Sessions by location vs orders by country | A country with sessions and almost no orders |
| Shipping cost | GA4 add_shipping_info by shipping_tier; carts below vs above the threshold | The drop sits under the threshold or on one shipping option |
What the cuts won't tell you is why. Analytics shows where shoppers stop. Session recordings and heatmaps filtered to the segment you found show the field that throws an error or the total that jumps. Then fix one thing, measure it, and move on to the next segment. Our website conversion funnel guide covers how to size each leak, and checkout flow optimization covers the fixes step by step.
Want a second pair of eyes on your numbers before Black Friday? Get a free audit and we'll show you which segment is leaking and what it's worth.
The bottom line
Our read: when checkouts are high and orders are low, the checkout is usually fine for most people and broken for someone specific. Don't redesign it on a hunch. Run the four cuts, find the someone, and fix their problem first.
It's also the cheapest kind of conversion work you'll ever do. These shoppers already chose a product and typed their details. Run your own numbers through the CRO ROI calculator to see what a few points of checkout completion are worth.
FAQ
Why do people reach checkout on Shopify but not buy?
Usually because something breaks for one group of shoppers, not for everyone. Split the drop by device, payment method, market and shipping cost. In Baymard's U.S. survey, extra costs like shipping, tax and fees were the top fixable reason at 40%.
What does "sessions that reached checkout" mean in Shopify?
It's the number of sessions with user input during checkout, such as a key press or a click, according to Shopify. In the open funnel, a session counts even if the shopper went straight to checkout without adding to the cart first.
How do I calculate my checkout conversion rate on Shopify?
Divide sessions that completed checkout by sessions that reached checkout for the same dates. Shopify's funnel shows every step as a share of total sessions, so do this division yourself and check it against your order count.
Why did my Shopify conversion rate change in September 2026?
Shopify updated how it measures sessions between September 21 and 23, 2026. Bot sessions are now filtered out by default and some sessions without a pageview now count, so conversion rate can move even when orders don't. Shopify says to use the post-update data as a new baseline.
What is a good checkout abandonment rate?
There isn't a universal number. Baymard's average across 50 studies is 70.22% for cart abandonment, but your own trend matters more than any benchmark. Watch your checkout completion by segment and see if it moves after each fix.
Get A Free Website Audit.
We’ll identify what’s leaking revenue on your site and show you how to fix it. The free audit includes: